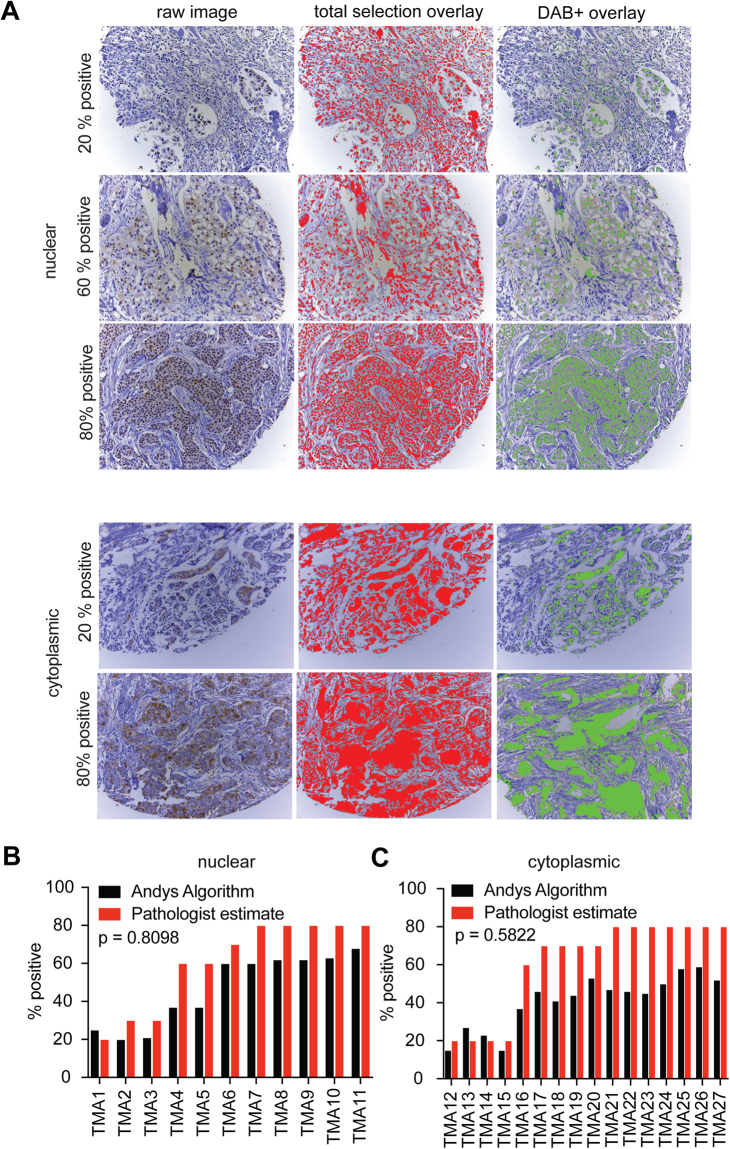
Figure 2.
Andy’s DAB+ IHC algorithm can be used to score breast cancer TMAs. (A) Representative raw IHC images (left panels) depicting 20–80% nuclear or cytoplasmic expression of MCL-1 using cores selected from a cohort of TMAs in22. Selection overlays produced after analysis of the raw MCL-1 IHC images for total (red) and DAB+ (green) selections. Bar graphs depicting the percentage of the core positive for MCL-1 with either nuclear (B, n = 11) or cytoplasmic (C, n = 16) staining scored with either Andy’s PLA pipeline (black) or manual pathological scoring (red). Chi-squared p-value.

