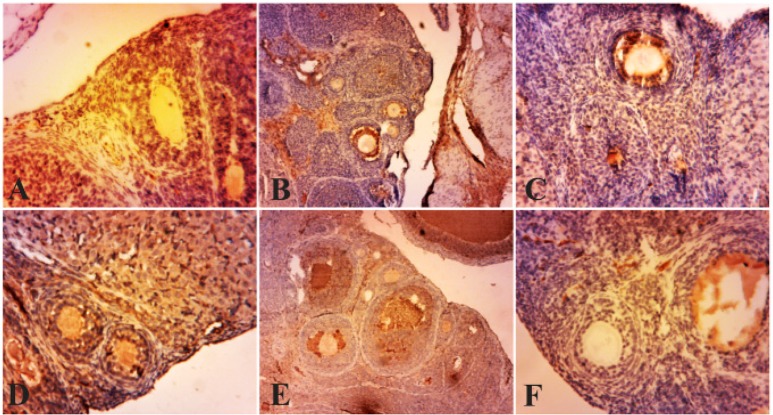
Figure 2.
Photo micrographs of immunohistochemical expression of TNF-α in the primary and secondary follicles. (A) normal ovary; (B) strict expression of TNF-α is observable in these follicles in PCOS group; (C, D, E, F) TNF-α expression is restricted to blood vessels and ovary stroma (filled arrow) in curcumin groups (100, 200, 300, 400 mg/kg BW). Magnification ×100, (Scale bar, 25 μm)

