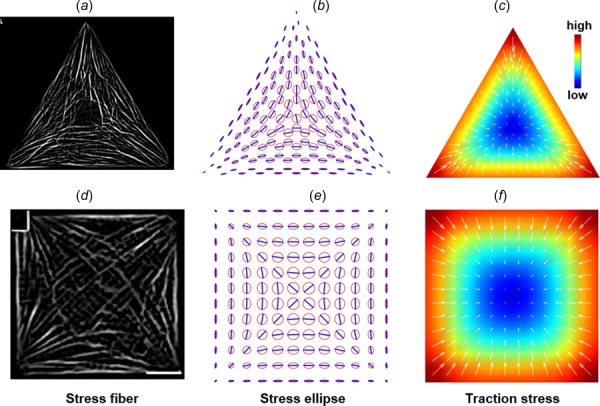
Fig. 4.

Myofibrils tend to assemble along the maximal principal stress directions. (a) and (d) Myofibril organizations in single cardiomyocytes (Reprinted with permission from Geisse et al. [24]. Copyright 2009 by Springer and Reprinted with permission from Bray et al. [14]. Copyright 2008 by Wiley.). (b) and (e) Model predictions of stress ellipses and MTS directions. (c) and (f) Predicted traction stress distributions. Parameter values: μ = 3.8 kPa, λ = 5.8 kPa, h = 3 μm, k0 = 0.18 kPa/μm, = 1 kPa, and cell area = 2000 μm2 (these values are used in the latter simulations unless specifically mentioned). Note that the spatial patterns of MTS and traction stress are robust for a range of parameter values.
