Figure 2.

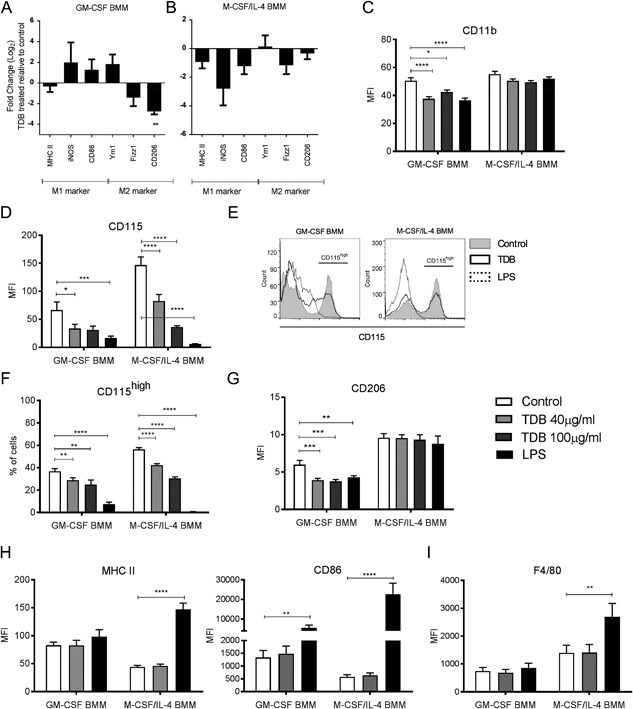
TDB changes the polarization of GM‐CSF and M‐CSF/IL‐4 BMM. Gene expression profile of TDB treated BMMs relative to untreated control. (A) GM‐CSF and (B) M‐CSF/IL‐4 BMMs were differentiated over 8 days, stimulated with 100 µg/mL TDB for 48 h, and relative gene expression was measured by q/RT‐PCR. Relative expression of cell surface markers (C) CD11b, (D) CD115, (G) CD206 and (H) MHC II, CD86, (I) F4/80 on GM‐CSF and M‐CSF/IL‐4 BMMs treated with 40 or 100 µg/mL TDB, or 100 ng/mL LPS as positive control, for 24 h. (E) The expression of CD115 by GM‐CSF and M‐CSF/IL‐4 BMMs shown as histogram and (F) the percentage of CD115high cells in TDB treated GM‐CSF and M‐CSF/IL‐4 BMMs. *P ≤ 0.05; **P ≤ 0.01; ***P ≤ 0.005; ****P ≤ 0.001 (two‐tailed Student's t‐test).
