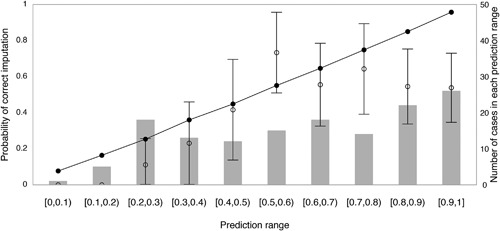
Figure 1.

Validation of imputation accuracy at the unphased multi‐locus genotype level. The prediction interval [0, 1] was subdivided into 10 bins. The proportion of correctly imputed genotypes and their 95% confidence bounds were calculated for each interval using normal approximation. The number of total predictions in each interval is represented by vertical bars. In the interval [0.4, 0.5], for example, 12 imputed genotypes were present whose imputation probability was between 0.4 and 0.5. The observed fraction of correct imputation was 5/12 = 0.42 (○), while the expected fraction of correct imputations measured by the average predicted probability in this bin was 0.44 (•).
