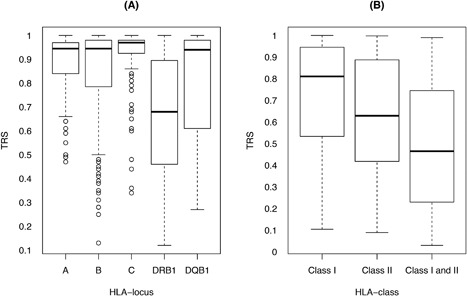
Figure 3.

Distribution of typing resolution score by HLA locus and class. Distribution of typing resolution score of unphased genotypes for HLA‐A, ‐B, ‐C, ‐DRB1, and ‐DQB1 loci in the Héma‐Quebec dataset is presented. On the left (A), results are presented per HLA locus. On the right (B), results are presented by class (I or II) and across loci (classes I and II).
