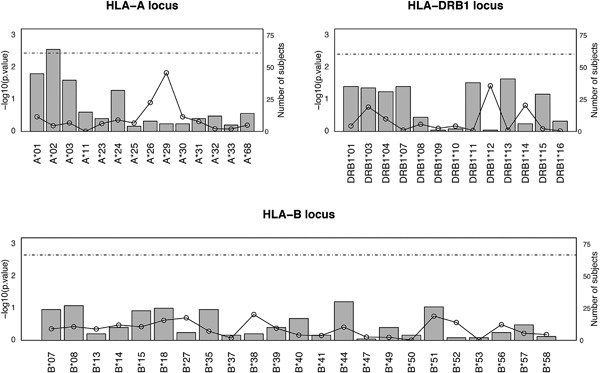
Figure 4.

Equality proportion test results for HLA‐A, ‐B, and ‐DRB1 loci. The proportion equality test‐statistic was used to evaluate whether the frequencies of first field HLA‐A, ‐B, and ‐DRB1 types observed in the study sample are comparable to the larger Quebecer hematopoietic stem cell donor population reported by Buhler et al. 12. P‐values of the equality test‐statistic in a −log10 scale are plotted for each locus. The threshold of significance following a Bonferroni correction for multiple testing is represented by the dotted horizontal line. The number of subjects (from a total study sample of 144 participants) with each HLA type is represented by vertical bars.
