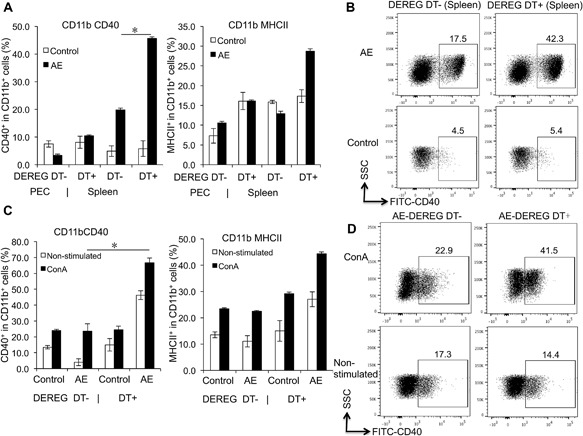
Figure 2.

CD40 and MHCII expression levels in both CD11b+ APCs in both AE‐DEREG DT‐ and AE‐DEREG DT+ mice at 1 month post‐infection, and in response to ConA. (A) Frequency of co‐stimulation markers CD40 and MHCII within CD11b+ APCs in peritoneal and spleen cells from AE‐DEREG DT‐ and AE‐DEREG DT+ mice 1 month post infection. (B) Representative images of CD40+ cells within CD11b+ APCs in spleen cells from both AE‐DEREG DT‐ and AE‐DEREG DT+ mice at 1 month post‐infection, non‐infected mice as Control mice. (C) Frequency of co‐stimulation markers CD40 and MHCII within CD11b+ APCs in spleen cells from AE‐DEREG DT‐ and AE‐DEREG DT+ mice, co‐cultured with 2 µg/mL ConA. (D) Representative images of CD40+ cells within CD11b+ APCs in spleen cells from both AE‐DEREG DT‐ and AE‐DEREG DT+ mice at 1 month post‐infection (non‐infected mice as Control mice), co‐cultured with 2 µg/mL ConA. The same cell reactions performed without ConA were used as non‐stimulated controls. DT application with 110 ng/in jection/mouse started 1 day before infection and was maintained for 4 months (three times/week). Data represent mean ± SD of three independent experiments of a total of 8–10 mice in each group (4–5 mice per group in each independent experiment). Comparison between groups was performed using a one‐way ANOVA with Bonferroni's multiple comparison post‐test for statistical analysis. *p < 0.01. “DEREG DT‐,” foxp3 inducible knock‐down mice (DEREG mice) without DT application; “DEREG DT+,” DEREG mice with DT application; “AE‐ DEREG DT‐,” E. multilocularis‐infected DEREG without DT application; “AE‐ DEREG DT+,” E. multilocularis‐infected DEREG mice with DT application. “Control,” non‐infected mice; “1 m,” 1‐month p.i.; “4 m,” 4 months p.i.. “PEC,” peritoneal exudate cells; “Spleen,” spleen cells.
