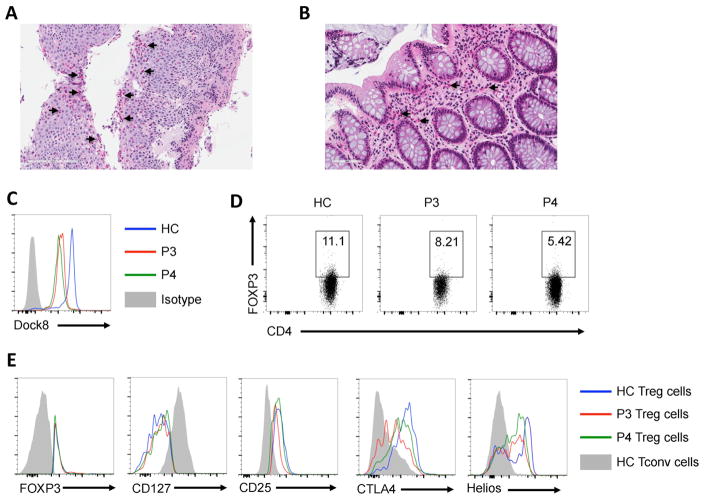
Fig. 3. Pathological and immunological features of patient P3.
(A, B) Representative pictures of esophageal and colonic tissue pathology in patient P3. Representative arrows illustrate eosinophil cell infiltration. (C) Flow cytometric analysis of DOCK8 expression in CD3+ T cells of P3 and P4 as compared to those of a HC subject. (D) Representative dot plot analysis of FOXP3 expression in CD4+ T cells of P3 and P4 as compared to those of a control subject. (E) Representative flow cytometric histogram plots of FOXP3, CD127, CD25, CTLA4 and Helios expression in FOXP3+CD4+ Treg cells of P3 (red tracing) and P4 (green tracing) versus those of a HC subject (blue tracing). Gray area represents expression in Tconv cells of a HC subject.

