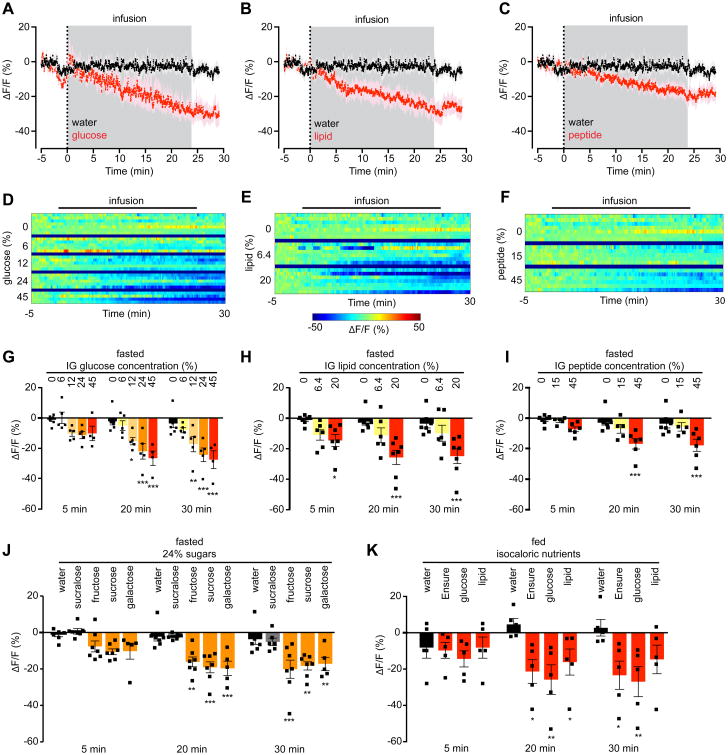
Figure 2. Inhibition of AgRP neurons by nutrients is independent of macronutrient composition or nutritional state and is proportional to calorie ingestion.
(A-C) Calcium signal from AgRP neurons in fasted mice during intragastric infusion with water (black) or isocaloric and isovolemic quantities of 45% glucose (A), 20% lipid (B), or 45% peptide (C) solutions (red). Traces represent mean ± SEM. Gray denotes infusion. (n = 4-7 mice per group)
(D-F) Peri-infusion heat maps depicting ΔF/F during photometry recording in fasted mice receiving intragastric infusion of the indicated concentrations of glucose (D), lipid (E), or peptide (F). Each row represents the average of 1-3 trials of an individual mouse. (n = 4-7 mice per group).
(G-I) Quantification of ΔF/F from (D-F).
(J) Quantification of ΔF/F during photometry recording in fasted mice receiving intragastric infusion of the indicated 24% mono- and disaccharide solutions or the non-caloric sweetener sucralose.
(K) Quantification of ΔF/F during photometry recording from AgRP neurons in ad libitum fed mice receiving intragastric infusion of the indicated isocaloric solutions. (n = 5 mice per group).
(G-K) ■ denotes individual mice. Times shown are 5-min windows from the early part of infusion (5 min), the end of infusion (20 min), and 10 min following the end of infusion (30 min). Bars represent mean ± SEM. *P < 0.05, **P < 0.01, ***P < 10-3 compared to H2O infusion at the indicated time point (Holm-Sidak multiple comparisons test, adjusted p-value).
See also Figure S2.

