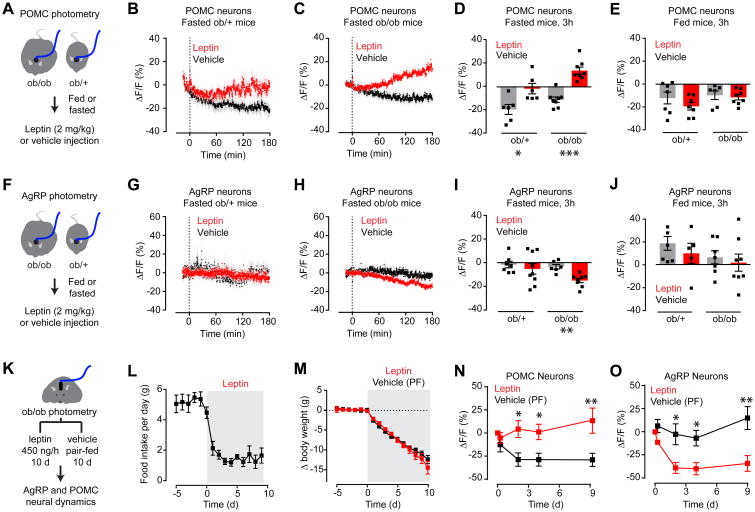
Figure 6. Leptin gradually modulates the activity of AgRP and POMC neurons in fasted animals.
(A) Schematic of experiments in (B-E). 3 hour photometry recording from POMC neurons in fasted or fed ob/ob and ob/+ mice injected with leptin.
(B and C) Calcium signal from POMC neurons in fasted ob/+ (B) and ob/ob (C) mice after vehicle (black) or leptin (red) injection. (n = 6-8 mice per group).
(D and E) Quantification of ΔF/F of POMC neurons after prolonged photometry recording following IP injection of vehicle or leptin in fasted (D) and fed (E) states.
(F) Schematic of experiments in (G-J). 3 hour photometry recording from AgRP neurons in fasted or fed ob/ob and ob/+ mice injected with leptin.
(G and H) Calcium signal from AgRP neurons in fasted ob/+ (G) and ob/ob (H) mice after vehicle (black) or leptin (red) injection. (n = 7-8 mice per group)
(I and J) Quantification of ΔF/F of AgRP neurons after prolonged photometry recording following IP injection of vehicle or leptin in fasted (I) and fed (J) states.
(K) Schematic of experiments in (L-O). Body weight, food intake, and photometry signals from AgRP and POMC neurons were measured in ob/ob mice during chronic leptin or vehicle infusion by mini-osmotic pumps. Vehicle treated animals were pair-fed (PF) to leptin treated animals. Mini-osmotic pump was implanted at day 0
(L and M) Food intake (L) and change in body weight (M) following vehicle or leptin infusion. (n = 9 mice per group).
(N and O) Quantification of ΔF/F following vehicle (black) or leptin (red) infusion by mini-osmotic pump in POMC (N) and AgRP (O) neurons. (n = 4 mice).
(B, C, G, H, L, M, N, O) Traces represent mean ± SEM
(D,E,I,J) ■ denotes individual mice. Bars represent mean ΔF/F ± SEM over a 15-min window 3 hours after injection.
*P < 0.05, **P < 0.01, ***P < 10-3
See also Figure S5.

