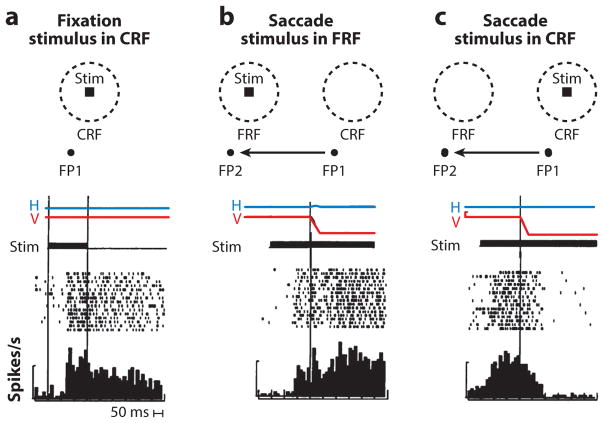
Figure 3.
Predictive remapping in the lateral intraparietal area. (a) Tonic visual response to the appearance of stimulus (stim) in the current receptive field (CRF) while the monkey fixates. Figure shows the placement of the fixation point (FP), the current spatial location of the stable-fixation receptive field (CRF), and the stimulus (stim). (Bottom, a–c) Horizontal (H) and vertical (V) eye position traces, and time of stimulus presentation (dark bar). In the raster diagram, each dot is a spike. Successive trials are synchronized on the appearance of the stimulus. The histogram sums the spikes. The bar drawn at the left of each raster is 100 spikes/s. The two vertical lines signify the beginning and end of the stimulus presentation. The tonic activity of the cell well outlasts the stimulus. (b) Remapping response. The saccade brings the stable-fixation receptive field onto the spatial location of the stimulus, which we call the future receptive field (FRF). Figure shows the spatial location of the stable-fixation receptive field when the monkey fixates FP1 (CRF), and the FRF (when the monkey fixates FP2, having made the saccade described by the arrow). The raster diagram is synchronized on the beginning of the saccade. The cell discharges before the saccade. (c) Saccade truncates the tonic response. The monkey makes a saccade from FP1 to FP2 (arrow). The raster is synchronized on the beginning of the saccade. The cell stops responding after the saccade even though the stimulus remains in the CRF. Figure adapted from Duhamel et al. (1992a) with permission.

