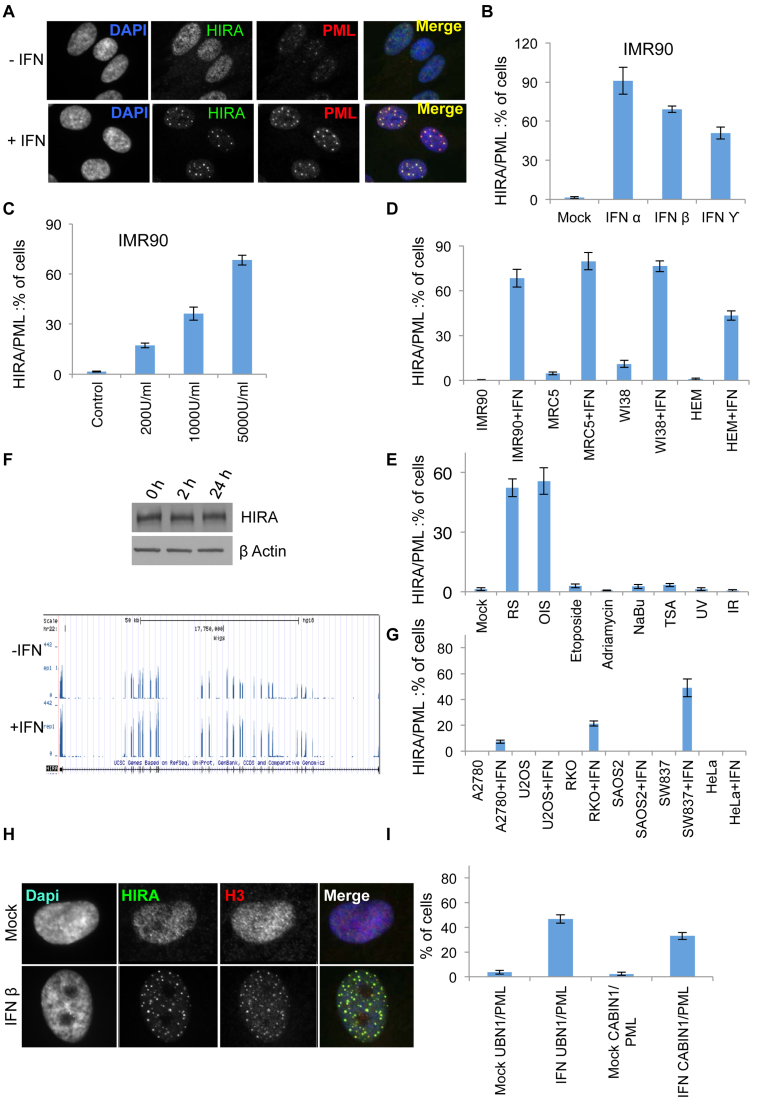
Figure 2.
Histone chaperone HIRA responds to IFN. (A) IMR90 cells fluorescently stained with antibodies to HIRA and PML 24 h post-treatment with 2000U/ml of IFN-β. (B) Quantitation of cells with HIRA localized to PML bodies from (A) and with cells treated with 2000U/ml each of IFN-α and IFN-γ. Data are mean ± SEM from three independent experiments, P < 0.05 comparing mock versus IFN-treated cells. (C) Quantitation of cells with HIRA localized to PML bodies in cells treated with increasing dose of IFN-β as indicated. Data are mean ± SEM from three independent experiments, P < 0.05 as compared to mock for all three doses. (D) Quantitation of cells with HIRA localized to PML bodies in primary cells (IMR90 fibroblasts, MRC5 fibroblasts, WI38 fibroblasts, human epidermal melanocytes (HEM)) treated with and without 2000U/ml of IFN-β. Data are mean ± SEM from three independent experiments, P < 0.05 as compared to its mock treated for each independent cell line. (E) Quantitation of cells with HIRA localized to PML bodies in cells with indicated triggers and replicative (RS) and oncogene-induced senescent (OIS) cells. Data are mean ± SEM from three independent experiments, P < 0.05 as compared to its mock treated for RS and OIS, p is non-significant for all other conditions. (F) Left panel: IMR90 cells treated with 2000U/ml of IFN-β and western blotted with indicated antibodies. Right Panel: genome browser representation of mRNA of HIRA in IMR90 cells treated with and without 2000U/ml of IFN-β. (G) Quantitation of cells with HIRA localized to PML bodies in cancer cell lines (A2780, U2OS, RKO, SAOS2, SW837 and HeLa) treated with and without 2000U/ml of IFN-β. Data are mean ± SEM from three independent experiments, P < 0.05 for A2780, RKO and SW837 cells as compared to their mock treated cells. p is non-significant for all other cell lines. (H) Cells from (A) were fluorescently labeled with antibodies to HIRA and histone H3. (I) Quantitation of cells with UBN1 and CABIN1 localized to PML bodies in IMR90 cells treated with and without 2000U/ml of IFN-β. Data are mean ± SEM from three independent experiments, P < 0.05 as compared to mock.

