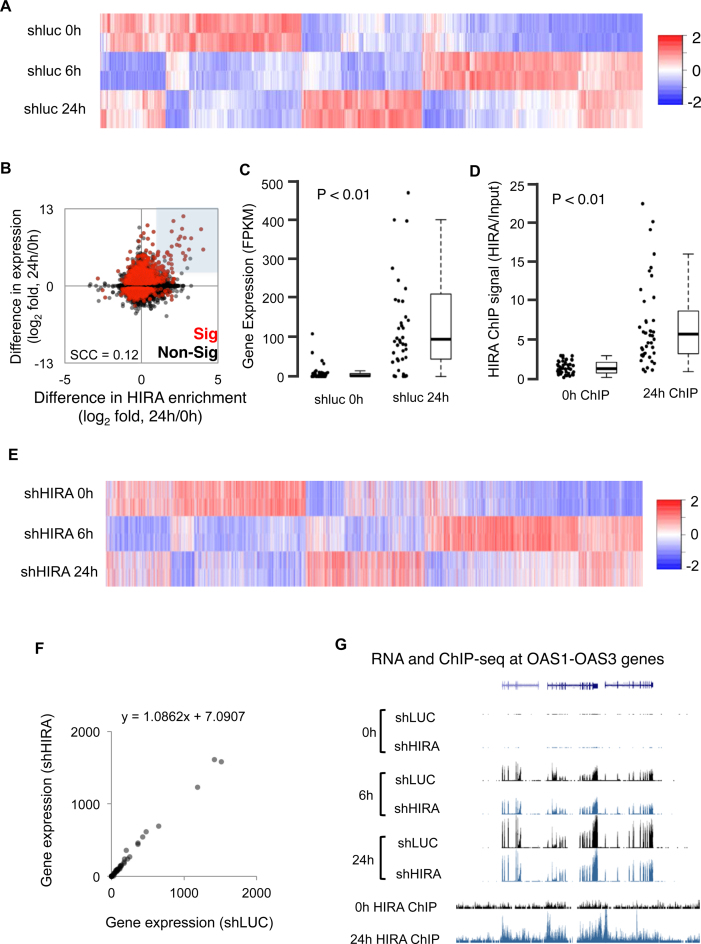
Figure 3.
HIRA is not required for activation of IFN target genes. (A–G) IMR90 cells were stably infected with lentivirus-encoded shRNAs to HIRA (shHIRA) or control (shLuc). Cells were then treated with IFN-β either for 6 h or for 24 h as indicated in the legend. (A) Column clustered heatmap of all differentially expressed genes (FDR ≤ 5%) between shLuc 0 and 6 h and/or between shLuc 6 and 24 h. Genes are given by column and samples by row. The color intensity represents column Z-score (based on FPKM), where red indicates more highly expressed, and blue more lowly expressed genes. (B) Scatter plot comparing the change in promoter (TSS ± 1 kb) HIRA enrichment with change in gene expression after IFN-β treatment for 24 h. Genes that change in expression significantly (FDR ≤ 5%) between shLuc 0 and 24 h are in red. All other genes are in black. HIRA ChIP-seq signals have been normalized to input control. The gray highlighted section shows genes with an expression fold ≥ 2.5 and HIRA fold ≥ 1 (also in Supplementary Figure S3D). (C) Box and jitter plots of shLuc 0 and 24 h gene expression (mean FPKM, n = 2) for the genes within the highlighted section of panel B. The P-value was calculated using a Wilcoxon rank-sum test, comparing 0–24 h. The bottom and top of the boxes correspond to the 25th and 75th percentiles respectively, and the internal band is the median. The plot whiskers correspond to the most extreme value within 1.5 × interquartile range. (D) As 3C, though measuring HIRA enrichment by ChIP-seq at 0 and 24 h. HIRA ChIP-seq signals have been normalized to input control. (E) Heatmap of the genes in A, ordered as 3A. Samples are HIRA knockdown using an shRNA hairpins (shHIRA). Genes are given by column and samples by row. The color intensity represents column Z-score (based on FPKM), where red indicates more highly expressed, and blue more lowly expressed genes. The experiment was done in parallel with shLuc cells in (A); however to simply heatmap, only results from the knockdown cells are shown (shHIRA). Indicated time points refer to hours post IFN-β treatment. (F) Scatter plot of the genes within the highlighted section of (B), comparing shLuc to shHIRA expression. Values are mean FPKMs (n = 2). The straight-line equation derived from a linear regression is given for both comparisons. Slope of the line indicates no difference between shLuc and shHIRA. (G) Representative UCSC plot of the OAS1–3 gene cluster, showing expression by RNA-seq (top six tracks) and HIRA enrichment by ChIP-seq (bottom two tracks). The Y-axis represents library normalized read count. For the gene tracks, introns are given as horizontal lines and exons as vertical boxes.

