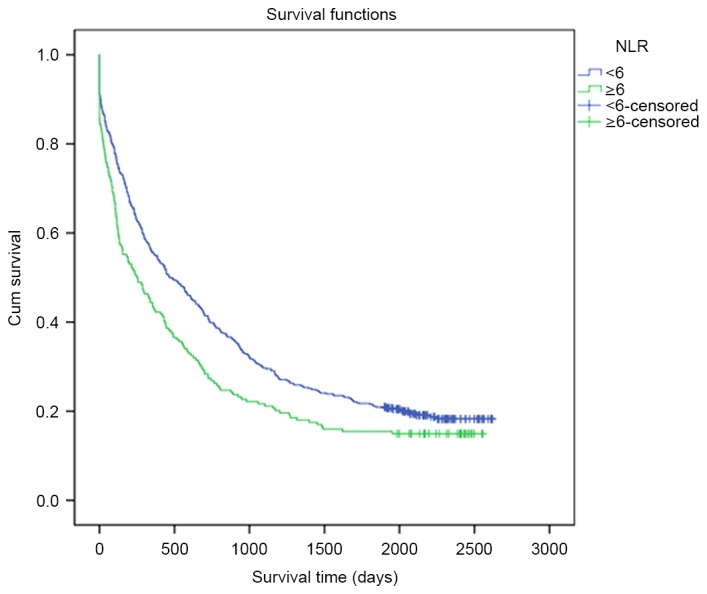
Figure 1.

OS rates of patients with lung cancer and differential NLRs. The blue curve represents the low NLR group (NLR<6), whereas the green curve represents the high NLR group (NLR≥6). Patients in the low NLR group indicated longer OS than patients in the high NLR group (819.57 days vs. 629.86 days, P=0.041). OS, overall survival; NLR, neutrophil-to-lymphocyte ratio.
