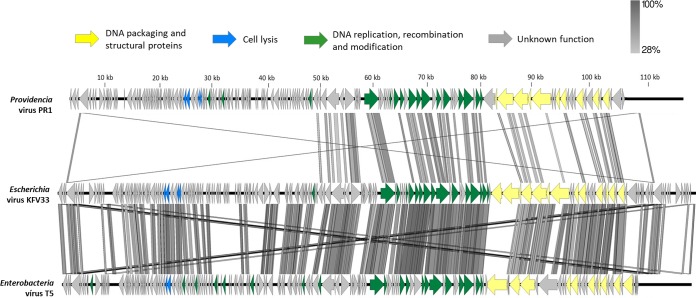
FIG 2.
Divergence of the core gene organization of PR1 from that of the closest phages. The PR1 genome was compared to that of Escherichia virus AKFV33 and Enterobacter virus T5 using tBLASTx within Easyfig. Arrows indicating ORFs are drawn to scale and colored in the reference genome according to their predicted functions. Gene similarity profiles between phages are indicated in grayscale (and percentages). Crisscrossed lines observed in the extremities are a result of the homology between the terminal repeats.

