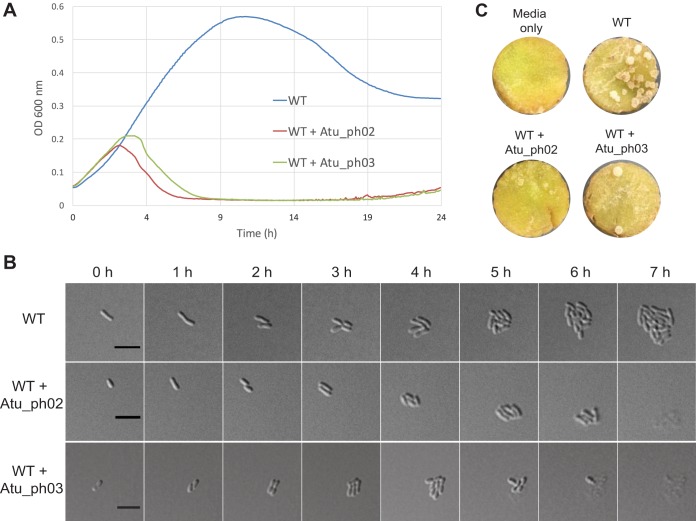
FIG 2.
Bacteriophages Atu_ph02 and Atu_ph03 lyse A. tumefaciens cells. (A) Growth curves of A. tumefaciens strain C58 (WT) infected with Atu_ph02 and Atu_ph03 at MOIs of 0.001. Results from representative growth curves are shown. Each line is the average from four replicate wells. (B) Time-lapse microscopy showing the growth of uninfected WT cells (top), WT cells infected with Atu_ph02 at an MOI of 0.01 (middle), and WT cells infected with Atu_ph03 at an MOI of 0.01 (bottom). Bars, 5 μm. (C) Representative potato discs treated with medium (top left), WT A. tumefaciens cells (top right), a mixture of WT A. tumefaciens cells and Atu_ph02 at an MOI of 1.0 (bottom left), and a mixture of WT A. tumefaciens cells and Atu_ph03 at an MOI of 1.0 (bottom right) after 14 days of incubation in a humid chamber. White spots on the potato discs are A. tumefaciens-induced tumors.

