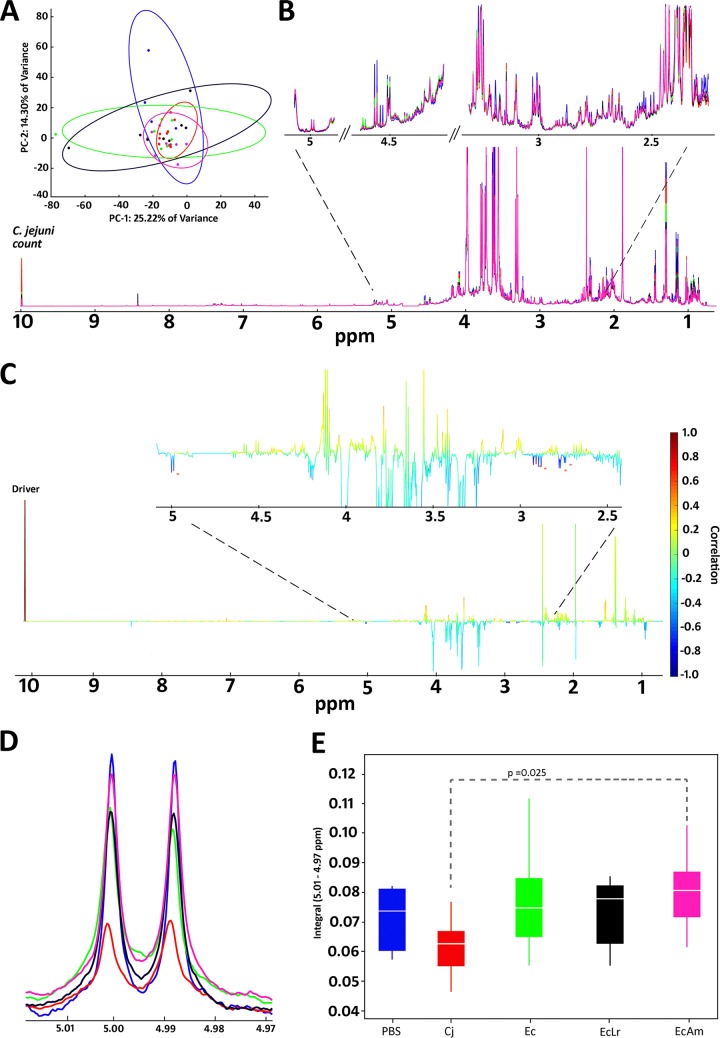
FIG 5.
NMR metabolomics. (A) PCA plot of aligned, normalized, and scaled data showing high overlap, large intragroup variability, and little separation across principal component 1 (PC1) and PC2. (B) Spectral overlay of averaged spectra within each group indicating a metabolite-rich spectrum with an expanded region of interest between 2.5 and 5 ppm. The C. jejuni posttreatment count has been integrated into the spectra at 10 ppm. (C) STOCSY output displaying correlation as color and covariance as peak height. Asterisks denote negative correlations with the C. jejuni count Driver peak (correlations, −0.60, −0.68, −0.68, −0.70, and −0.60, respectively, from left to right). (D) Expansion of 5 ppm denoting the different study groups as labeled in panel E. (E) Integral distribution of the 5-ppm feature and ANOVA indicating a significant difference between the nonvaccinated but challenged Cj group and the vaccinated and challenged EcAm group (P = 0.025). There were no significant differences between the other groups.

