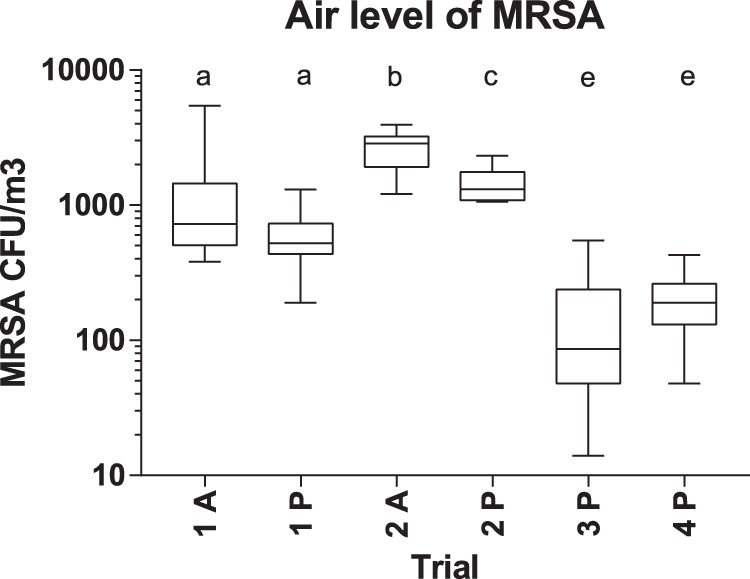
FIG 2.

Air level of MRSA (CFU/m3) in the four trials. A, active group with pig contact; P, passive group. Box-and-whisker plot indicates median, interquartile ranges, and maximum and minimum values. Different letters above the graph indicate significant differences between groups (two-sided t test, P < 0.05).
