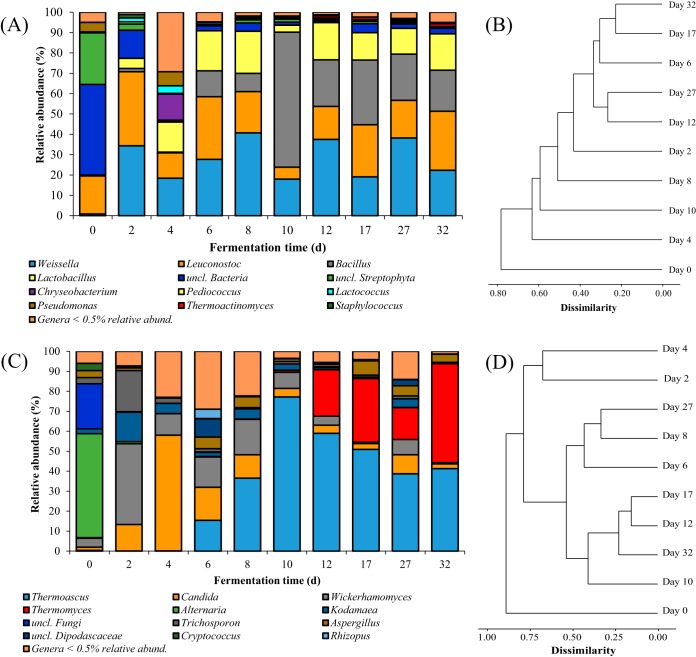
FIG 2.
Temporal patterns of microbial community structure during the fermentation process of MT-Daqu. (A) Temporal profile for the relative abundance of bacterial taxa represented at the genus level; (B) distance tree based on V1-V3 16S rRNA gene amplicon sequences of bacteria in MT-Daqu constructed by the unweighted pair group method with arithmetic mean (UPGMA); (C) temporal profile for the relative abundance of fungal taxa represented at the genus level; and (D) distance tree based on ITS1 ITS rRNA gene amplicon sequences of fungi in MT-Daqu constructed by UPGMA.

