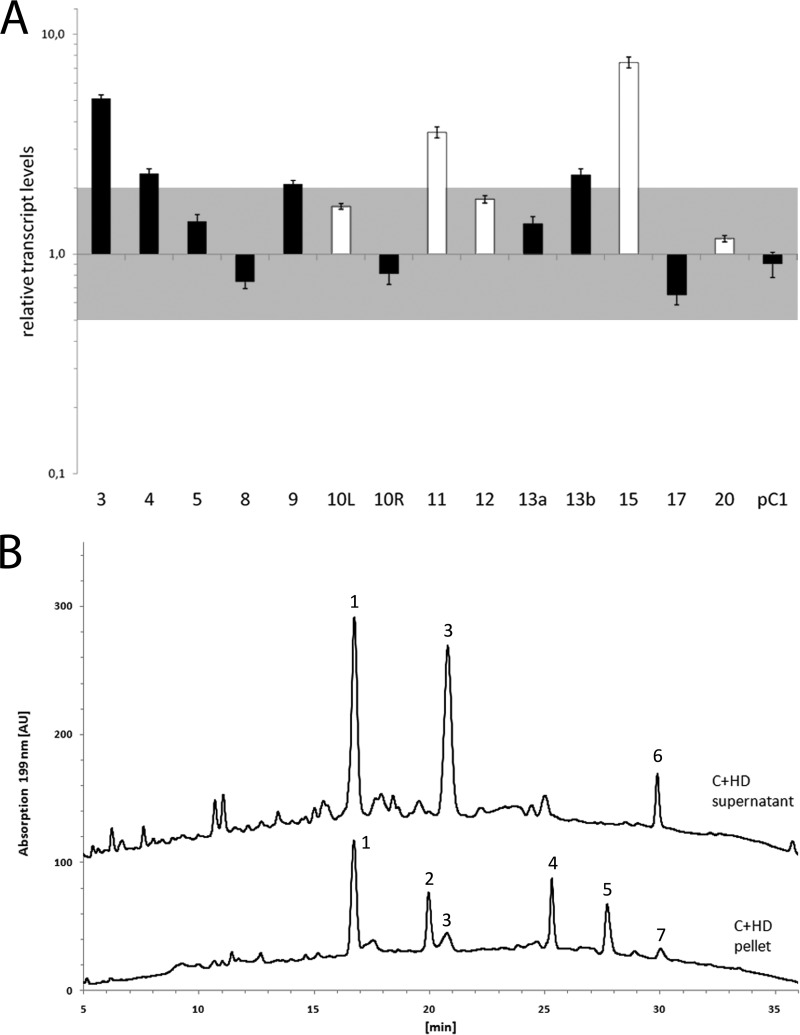
FIG 4.
Comparison of BGC transcription and metabolite accumulation in a C culture treated with HD supernatant for 7 days (C+HD) and C cultivation. (A) Relative transcription of BGCs in C+HD versus C cultivation. All transcript levels were normalized to the rnpB housekeeping gene. The relative transcript level range between −0.5 and 2 is shaded in gray. Numbers relate to the BGC identifiers of the AntiSMASH platform, as listed in Table 1. White bars highlight BGCs that are exclusively upregulated in C+HD cultures. (B) HPLC profile of cellular extracts and supernatants of N. punctiforme PCC 73102 from C+HD cultures. The results of MALDI-TOF analysis of peaks 1 to 7 are given in Fig. S1 in the supplemental material; the results of MALDI-TOF MS PSD analysis of peaks 1 to 3 are given in Fig. S2 in the supplemental material. The HPLC profiles of conventional cultures grown without treatment are shown in Fig. 3. Peaks: 1, nostopeptolide 1052; 2, nostopeptolide A; 3, nostamide A; 4 to 7, unknown.

