Figure 2.

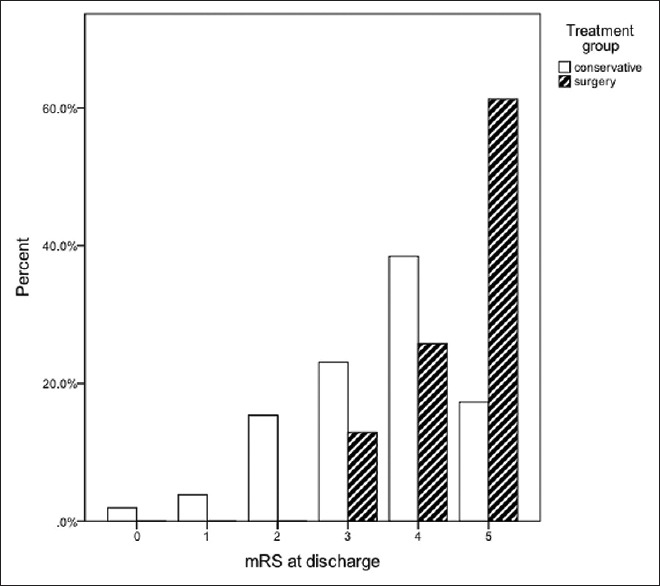
Functional outcome of the surviving patients (n = 30 in operative group, n = 53 in conservative group) at hospital discharge. The error bars represent 95% confidence intervals. The difference was statistically significant (P < 0.001)

Functional outcome of the surviving patients (n = 30 in operative group, n = 53 in conservative group) at hospital discharge. The error bars represent 95% confidence intervals. The difference was statistically significant (P < 0.001)