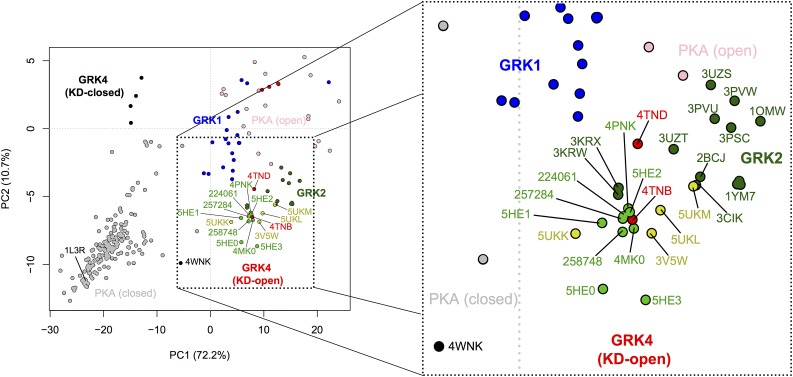
Fig. 5.
PC analysis of GRK and PKA structures. PC1 represents the opening and closing of the small and large lobes at the hinge, whereas PC2 corresponds to a smaller twisting motion of the small lobe relative to the large lobe. Circles indicate the PCA coordinates for the kinase domains in deposited crystal structures of GRKs and PKA: KD-closed and -open GRK4 subfamily members (black and red, respectively), GRK1 (blue), and closed and open PKA (gray and pink, respectively). GRK2–Gβγ complexes with compounds containing a benzodioxole or an indazole warhead are shown in bright yellow and green, respectively. The remaining GRK2 structures are indicated in dark green. Key structures are labeled with their PDB codes (for previously published structures) or compound codes (for new structures reported in this article). The axes indicate the displacement from the mean conformation along either PC1 or PC2, with numbers in axis labels showing the percentage of total structural variance captured by PC1 or PC2.

