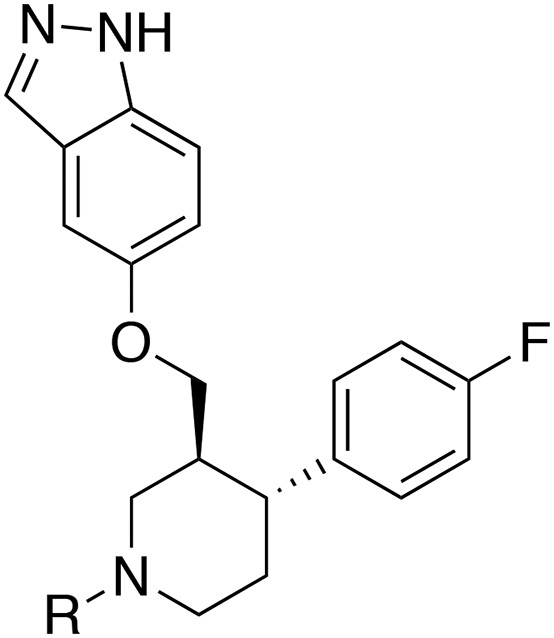
TABLE 2.
Kinase activity of alkylated indazole-paroxetine hybrids
| CCG# | R | GRK2 IC50 (μM)a | GRK1 IC50 (μM)a | GRK5 IC50 (μM)a | PKA IC50 (μM)a | ROCK1b (%) |
|---|---|---|---|---|---|---|
| 224061 | H | 0.066 (1.1) | 6.4 (1.3) | 1.3 (1.2) | 3.1 (1.4) | 100 ± 1.5 |
| 258001 | Me | 0.28 (1.5) | 52 (1.1) | 33 (1.2) | 85 (1.2) | 61 ± 5.3 |
| 258211 | Et | 0.96 (1.3) | >100 | >100 | >100 | 45 ± 1.5 |
| 258746 | iPr | 1.8 (1.2) | >100 | >100 | NT | 33 ± 10.3 |
All IC50 measurements are reported as the geometric mean of three separate experiments run in duplicate. Error is expressed in parenthesis as the geometric S.D. factor (multiplied or divided by the mean).
Percent inhibition at an inhibitor concentration of 10 μM, error is expressed as the S.D.
