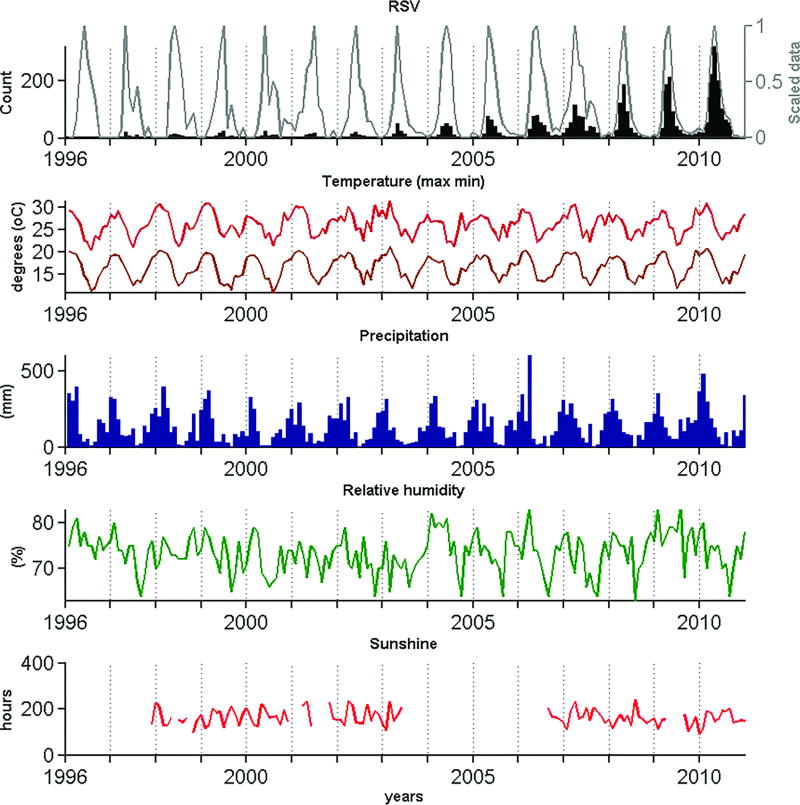
Figure 1.
Time series showing RSV detection rates and seasonal variation in climatic parameters in the metropolitan area of São Paulo (1996–2010). In addition to showing original counts of RSV-positive samples (black, upper panel), the epidemiological series was also de-trended (scaled) to enable the visualization and comparison of the seasonal signal along the entire period (white, upper panel).

