
Figure 1. HDR-Mediated Genome Editing in the Embryonic Brain.
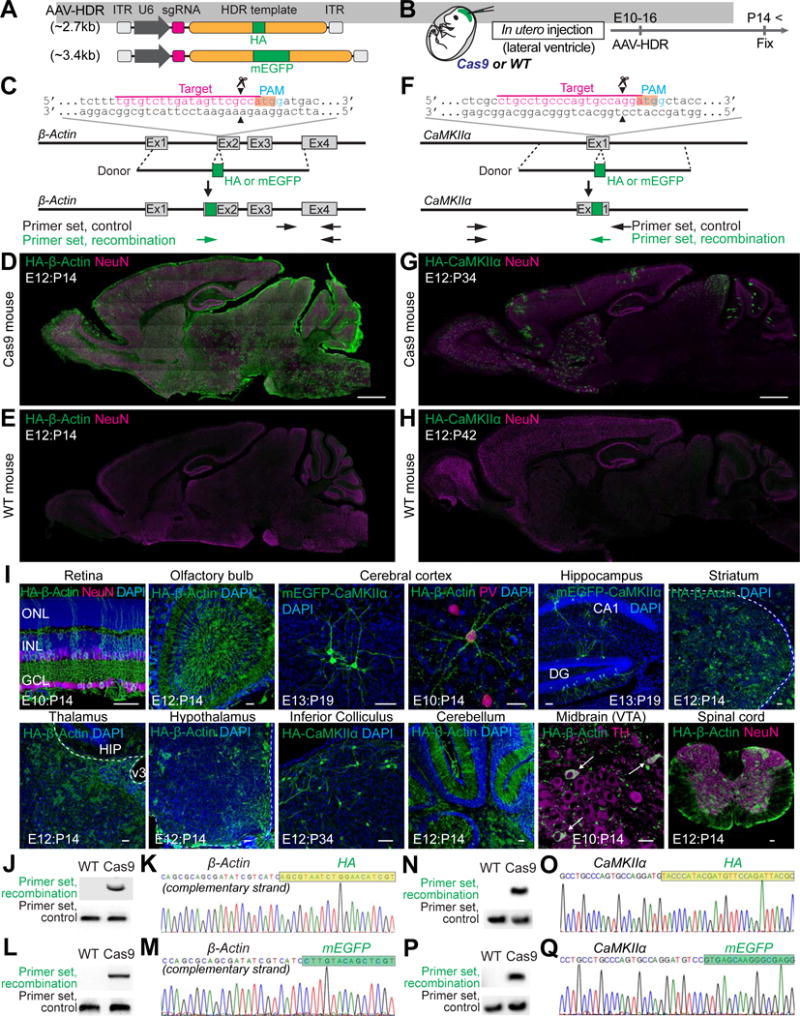
(A) Schematic of AAV-HDR for the delivery of a sgRNA and HDR donor template to insert the HA tag or mEGFP sequence. U6, human U6 Polymerase III promoter.
(B) Schematic illustration of experiments.
(C and F) Graphical representation of the mouse genomic loci of β-Actin (C) and CaMKIIα (F) showing the target sites for Cas9. The sgRNA targeting sequences are labeled in magenta. The protospacer-adjacent motif (PAM) sequences are labeled in blue. The start codons of β-Actin and CaMKIIα are marked in orange. The Cas9 cleavage sites are indicated by the black arrowheads. PCR primer sets (control and recombination) for PCR genotyping (J, L, N, and P) are indicated by the arrows.
(D, E, G, and H) Confocal microscopic images of whole sagittal brain sections of Cas9 (D and G) and wild type (E and H) mice showing immunoreactivities for NeuN (magenta) and the HA tag (green) fused to the N-terminus of endogenous β-Actin (D and E) and CaMKIIα (G and H).
(I) Confocal microscopic images of various brain regions showing the DAPI signal (blue), mEGFP-CaMKIIα fluorescence (green), and immunoreactivities for NeuN, parvalbumin (PV), or tyrosine hydroxylase (TH) (magenta) and the HA tag (green) fused to the N-terminus of endogenous β-Actin or CaMKIIα. GCL, ganglion cell layer; INL, inner nuclear layer; ONL, outer nuclear layer (Retina). DG, dentate gyrus (Hippocampus). HIP, hippocampus; v3, third ventricle (Thalamus). VTA, ventral tegmental area; white arrows, TH positive neurons (Midbrain).
(J, L, N, and P) PCR genotyping using genomic DNAs extracted from the AAV-HDR injected brains of wild type and Cas9 mice. Recombination and control primer sets for HA-β-Actin (J), mEGFP-β-Actin (L), HA-CaMKIIα (N), and mEGFP-CaMKIIα (P) were used for PCR.
(K, M, O, and Q) DNA sequencing analysis of the PCR products for HA-β-Actin (K), mEGFP-β-Actin (M), HA-CaMKIIα (O), and mEGFP-CaMKIIα (Q). The HA tag and mEGFP sequences are marked in light green and green, respectively.
Scale bars, 1mm (D and G); 50 μm (I).
See also Figures S1–4, STAR Methods, and Table S2 and S3.