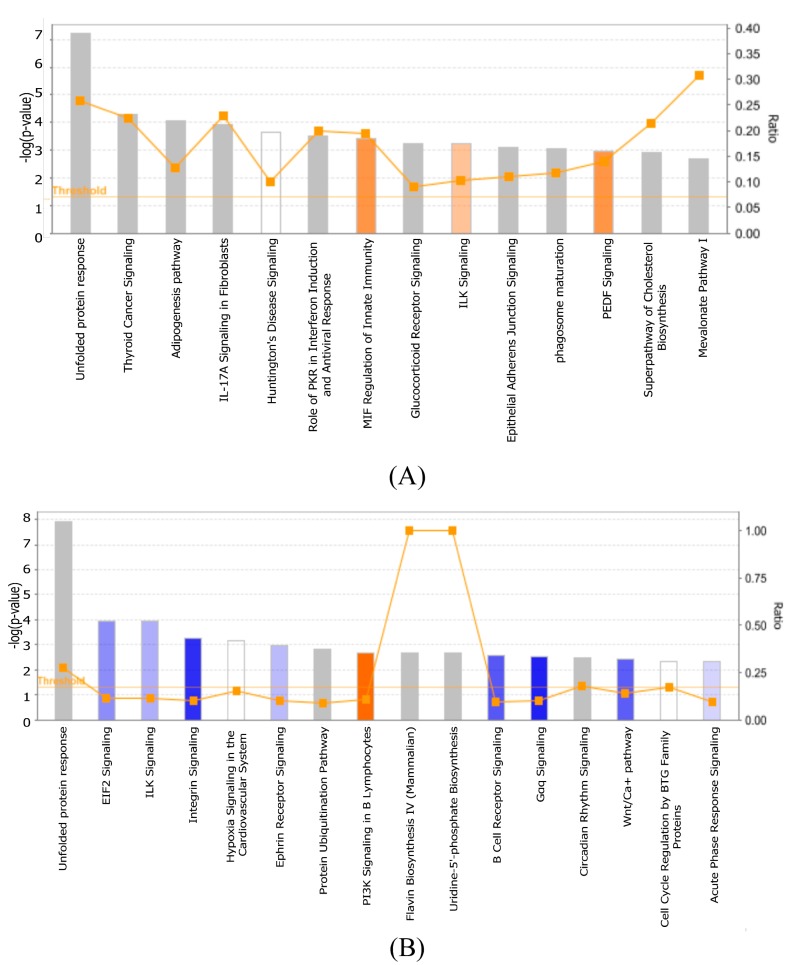
Figure 5.
Deregulation of biological process during ZIka virus (ZIKV) infection. (A) 48 hpi and (B) 72 hpi of the top canonical pathways that were deregulated during ZIKV infection of SVG cells. The color of the bars indicates predicted pathway activation based on z-score (orange = activation; blue = inhibition; gray = no prediction can be made; white = z-score close to 0). Orange line represents the ratio = # genes in dataset/total # of genes that compose that pathway. The horizontal yellow line indicates the p-value threshold. Fisher’s exact test, right-tailed, was used to calculate negative log of p-value.

