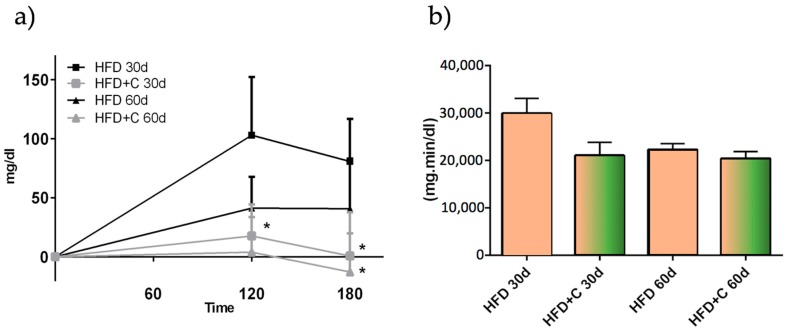
Figure 5.
(a) Plasma TAG kinetic curve comparison between HFD (black square) and HFD + C (grey triangle) during the experimental study trial. The values were expressed as increment from basal TAG values (TAG mg/dL increment mean ± SD, n = 6). Stars indicate that the values were significantly different (p < 0.05 with *); (b) Area under the curve (AUC) of the experimental groups at different point of times.

