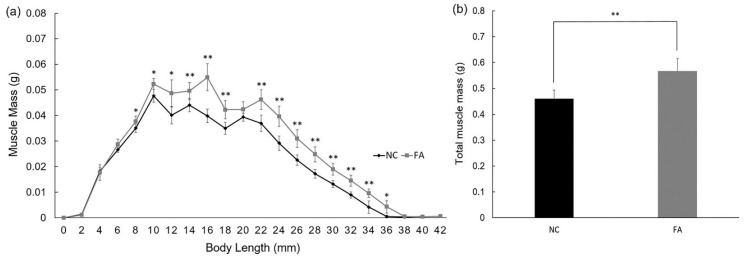
Figure 2.
Effects of ferulic acid on muscle mass of adult zebrafish. (a) Muscle mass contained per slice in each group. Computed Tomography (CT) scan was taken every 2 mm from head to tail; (b) Average muscle mass in total for each group. Data are expressed as mean ± SD (n = 5 per group from Population 1), * p < 0.05, ** p < 0.01 compared with the NC group.

