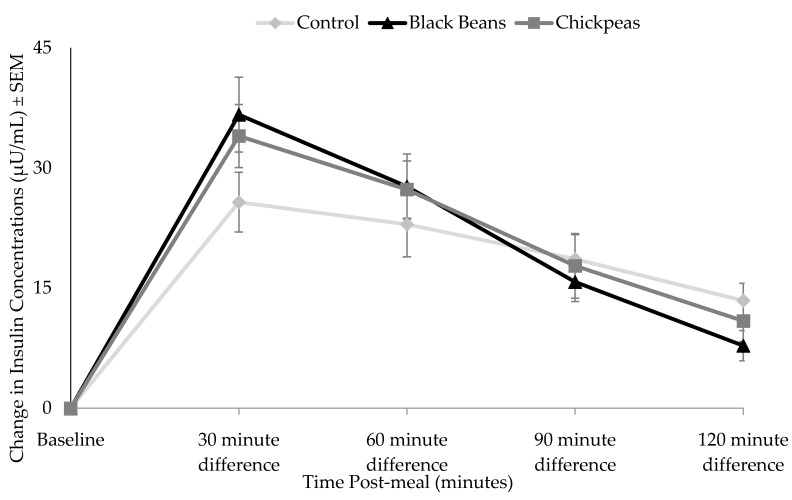
Figure 2.
Effect of bean treatments on change in plasma insulin from fasting values. Points denote mean insulin concentration at each data collection timepoint and error bars denote standard error of means. Results of a post-hoc paired t-test indicated that the insulin response curve was significantly different at 30 (p = 0.037) for black beans (n = 12), and at 30 (p = 0.026) for chickpeas (n = 9) compared to the white rice control meal.

