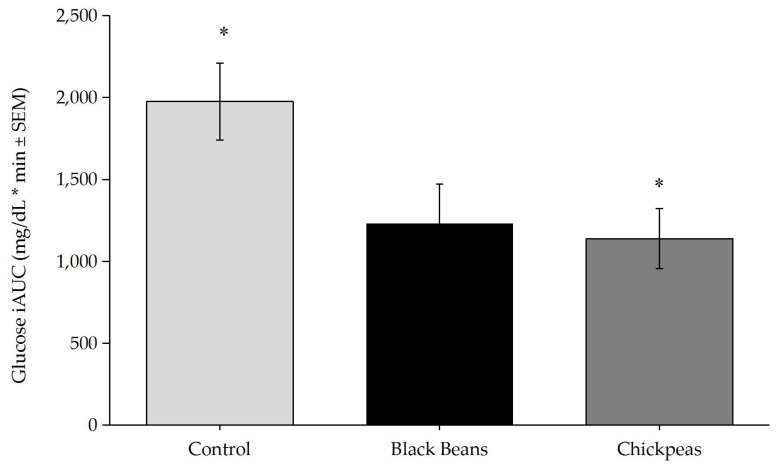
Figure 3.
One-way Analysis of Variance of glucose iAUC was significantly different by treatment (p = 0.027). Tukey post-hoc tests indicated a significant difference between chickpeas and control (p = 0.047), and a trend was observed between black beans and control (p = 0.058). * p < 0.05. Bars denote mean insulin iAUC values and error bars denote standard error of means.

