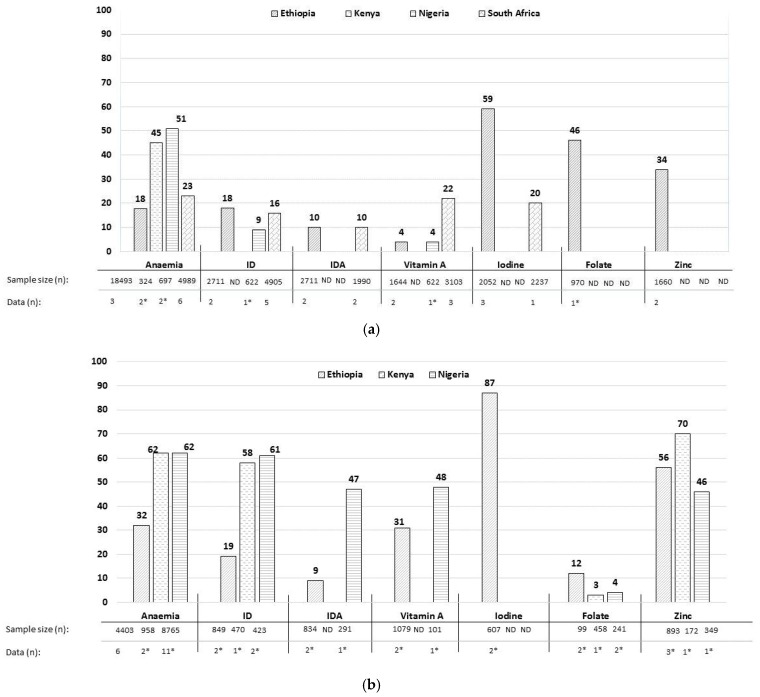
Figure 2.
(a) Prevalence of micronutrient deficiencies (%) in women of reproductive age in Ethiopia, Kenya, Nigeria and South Africa. The prevalence in percentage (%) are reported as weighted average (WAVG), i.e., an average prevalence that was weighted for the sample size of the studies (subnational data) and national surveys (national data); data (n) show number of studies and surveys included; * only subnational data; ID: iron deficiency; IDA: iron deficiency anaemia; ND: no data. (b) Prevalence of micronutrient deficiencies (%), in pregnant women in Ethiopia, Kenya and Nigeria. The prevalence in percentage (%) are reported as weighted average (WAVG), i.e., an average prevalence that was weighted for the sample size of the studies (subnational data) and national surveys (national data); data (n) show number of studies and surveys included; * only subnational data; ID: iron deficiency; IDA: iron deficiency anaemia; ND: no data.

