Figure 2.
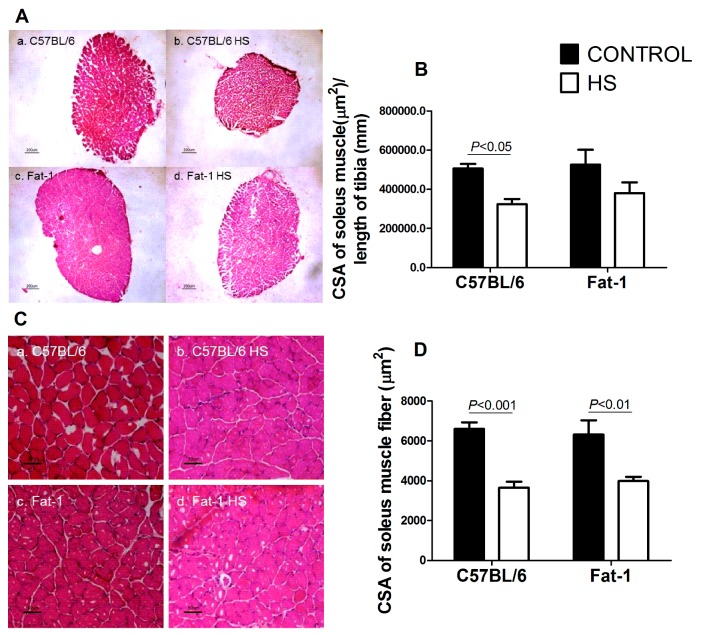
Cross-sectional areas (CSA) of the soleus muscle and soleus muscle fibers of the four groups studied (C57BL/6, C57BL/6 + HS, Fat-1, Fat-1 + HS). (A) Representative histological hematoxylin and eosin staining images of cross-sectional areas of the whole soleus muscle. a. C57BL/6; b. C57BL/6 + HS; c. Fat-1; d. Fat-1 + HS. Reference bar represents 200 µm. (B) Cross-sectional area of the soleus muscle. Values are presented as mean ± SEM, n = 7–8 animals. (C) Representative histological hematoxylin and eosin staining images of cross-sectional areas of soleus muscle fibers. a. C57BL/6; b. C57BL/6 + HS; c. Fat-1; d. Fat-1 + HS. Reference bar represents 50 µm. (D) Cross-sectional areas of soleus muscle fibers. Values are presented as mean ± SEM, n = 6–8. The results were compared using two-way ANOVA and Bonferroni post-hoc test. In (B) and (D), p values indicate significant differences using the Bonferroni post-hoc test. HS: hindlimb suspension; CSA: Cross-sectional area. 3.7. Activities of Cathepsin L and 26S Proteasome in the Gastrocnemius Muscle, and Contents of Atrogin-1/MAFbx and MuRF1 in the Soleus Muscle.

