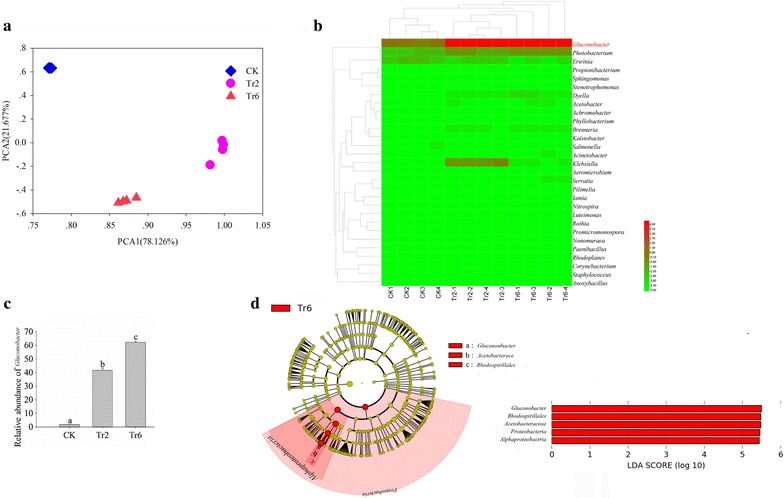
Fig. 2.

Bacterial communities in guava inoculated with fly eggs. a Principal components analysis of bacterial communities. b Cluster analysis cladogram showing the identified bacteria. The data were log transformed before plotting. c Difference in abundance of Gluconobacter sp. d Key factor screening for differences between samples by LEfSe analysis, the biomarkers with LDA scores above 4.0 were showed in green or red dots in the cladogram. Means (± SEM) labeled with different letters are significantly different; CK: guava fruit sample collected 1 day after inoculation with fly eggs; Tr2: guava fruit sample collected 2 days after inoculation with fly eggs; Tr6: guava fruit sample collected 6 days after inoculation with fly eggs
