
Fig. 4.
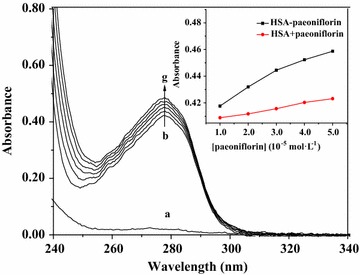
Absorption spectra of paeoniflorin alone (a) and HSA in the presence of different concentrations of paeoniflorin (b–g); Inset: comparison of the absorption values at 280 nm between the HSA–paeoniflorin mixed solutions and the sum values of free HSA and free paeoniflorin, a: [paeoniflorin] = 1.0 × 10⁻⁵ mol L−1; b–g: [HSA] = 1.0 × 10⁻⁵ mol L−1, [paeoniflorin] = 0, 1.0, 2.0, 3.0, 4.0, 5.0 × 10⁻⁵ mol L−1