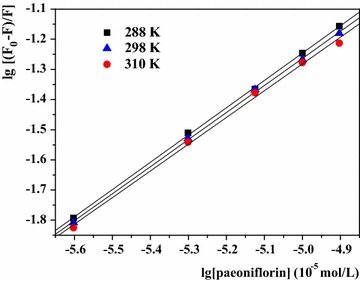
Fig. 5.

Double logarithm plot of HSA + paeoniflorin solutions with paeoniflorin concentrations (from 0.0 × 10⁻⁵ to 1.25 × 10⁻⁵ mol L−1 at 2.5 × 10⁻⁶ mol L−1 intervals) at three temperatures ([HSA] = 1.0 × 10⁻⁵ mol L−1)

Double logarithm plot of HSA + paeoniflorin solutions with paeoniflorin concentrations (from 0.0 × 10⁻⁵ to 1.25 × 10⁻⁵ mol L−1 at 2.5 × 10⁻⁶ mol L−1 intervals) at three temperatures ([HSA] = 1.0 × 10⁻⁵ mol L−1)