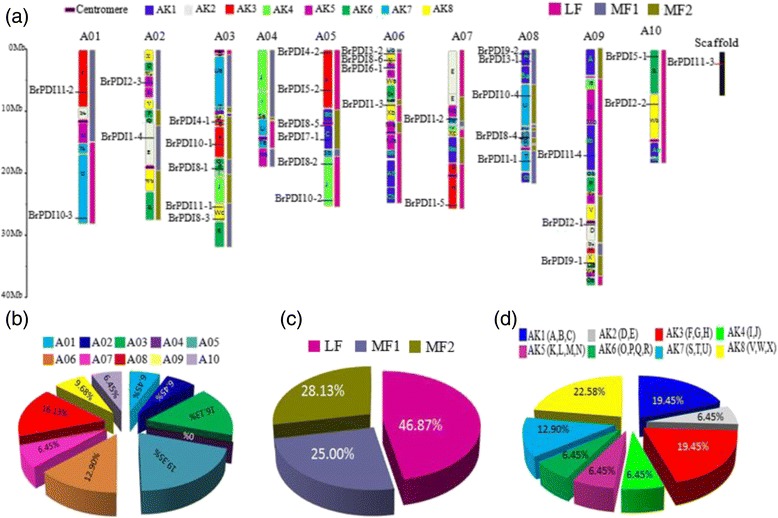
Fig. 4.

a Distribution of BrPDI genes on 10 chromosomes. The 24 (A to X) ancestral blocks and three sub-genomes are plotted, based on the report of Schranz et al., [46]. b The percentages of BrPDI genes on ancestral blocks are demonstrated in graph. c The percentages of BrPDI genes on each subgenomes are demonstrated in pie graph. Least fractionated (LF), medium fractionated (MF1) and most fractionated (MF2) genomes. d The percentages of BrPDI genes on each chromosome are also demonstrated in pie graph
