Fig. 1.

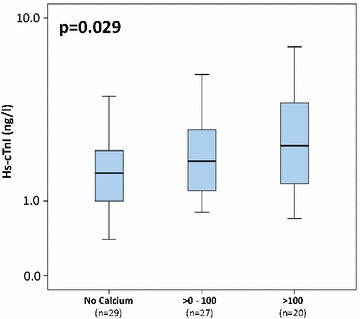
Boxplots illustrating significantly increasing levels of hs-cTnI in the following groups: no CAC, Agatston score from 1 to 100, and Agatston values greater than 100

Boxplots illustrating significantly increasing levels of hs-cTnI in the following groups: no CAC, Agatston score from 1 to 100, and Agatston values greater than 100