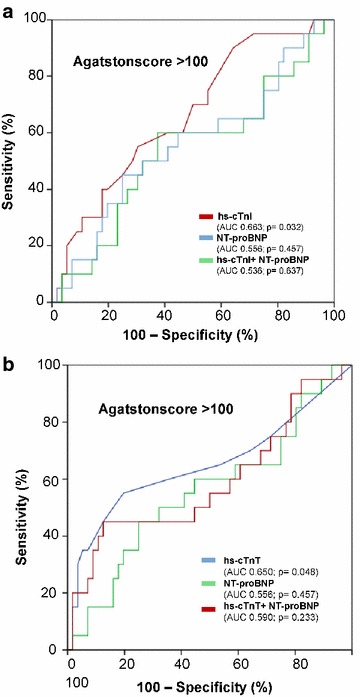
Fig. 3.

Receiver operating characteristic (ROC) curves demonstrating the capacity of hs-cTnI and hs-cTnT to discriminate significantly Agatston values greater than 100 (a, b)

Receiver operating characteristic (ROC) curves demonstrating the capacity of hs-cTnI and hs-cTnT to discriminate significantly Agatston values greater than 100 (a, b)