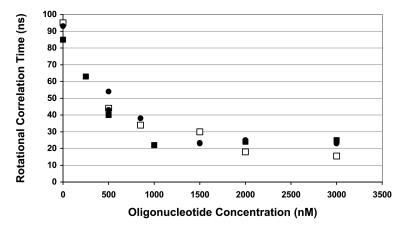
Figure 4.
Normalized rotational correlation time of IN during the titration with the DNA substrate. IN concentration was 100 nM (squares) or 200 nM (circles). Temperature was 25°C (open symbols) or 37°C (filled symbols). The temperature of normalization was 20°C (see text). The ODN was double-stranded 21-mer. Because the results were similar using either labeled DNA (F21U5B/21U5A) or unlabeled DNA (21U5B/21U5A), the different data then were compiled. Relative errors are about 10%.

