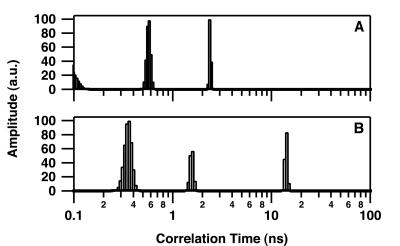
Figure 7.
Correlation time distribution of the IN–DNA complex by monitoring 3MI-containing ODNs. (A) PTER1/21U5A alone at 25°C. (B) PTER1/21U5A in the presence of 100 nM IN at 25°C. Excitation and emission wavelengths were 370 and 440 nm, respectively. The lifetime distribution was not influenced by the protein binding: τ1 = 0.1 ± 0.05 ns (36%); τ2 = 0.5 ± 0.2 ns (32%); τ3 = 1.7 ± 0.1 ns (16%); τ4 = 4.9 ± 0.1 ns (16%).

