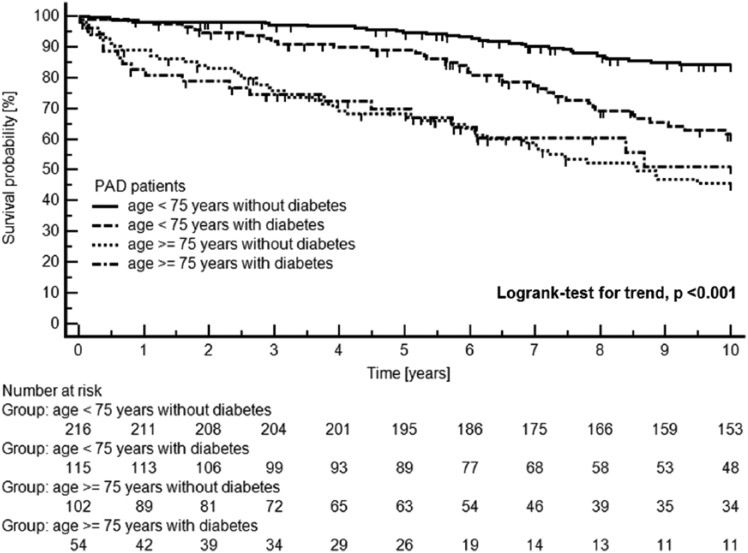
Figure 2.
Kaplan–Meier plot of cardiovascular mortality in 487 patients with symptomatic PAD separated by age groups and diabetes mellitus status.
Censored data due to ‘cancer mortality’ and due to ‘other mortality’ (for definitions, please see the ‘Materials and methods’ section) are tagged with small vertical lines on the Kaplan–Meier curves.

