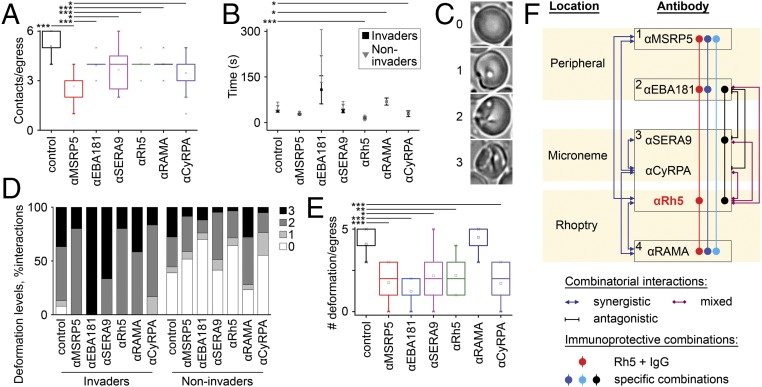
Fig. 4.
Video microscopy of erythrocyte invasion reveals discrete roles for candidate antigens. More than 40 egress events were recorded in the presence of IgG against each target, and a range of invasion-related phenotypes was quantitated. (A) Number of merozoite contacts that occur after each egress event. (B) Time taken (s) between merozoite contact and erythrocyte deformation, sometimes referred to as preinvasion, quantitated for merozoites that went on to productively invade erythrocytes (invaders) and those that did not (noninvaders). Total number of events analyzed in A and B: control, 63; anti-PfMSRP5, 65; anti-PfEBA181, 49; anti-PfSERA9, 53; anti-PfRh5, 50; anti-PfRAMA, 55; anti-PfCyRPA, 52. (C) Examples of deformation scores from 0 (no deformation) to 3 [strong deformation (26)]. (D) Range of deformation scores for every merozoite–erythrocyte interaction, quantitated for both invaders and noninvaders. (E) Number of deformation events that take place after each egress event. *P < 0.06, **P < 0.001, ***P < 0.0005. (F) Schematic summarizing the data in this study for each antigen: the phase of invasion they function in, as determined by video microscopy (numbered black boxes one to four); the synergistic (dark blue arrows), antagonistic (black bars), and mixed synergistic/antagonistic interactions (purple diamonds) between antibodies targeting these antigens based on isobologram analyses; the immunoprotective combinations of antigens revealed in the Malian cohort study (connected circles); and the physical location of the proteins on merezoites (beige boxes).

