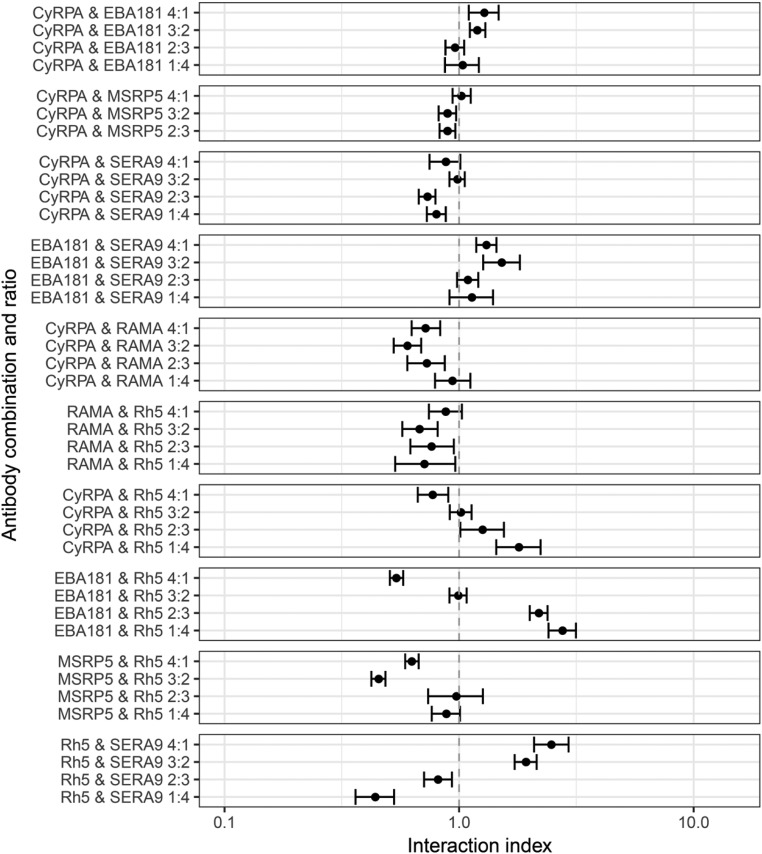
Fig. S5.
CIs for synergy/antagonism in antibody combinations. Dose–response data were analyzed to calculate an interaction index, calculated as the sum of the two FIC50 values for each ratio. CIs were computed for the interaction indices by propagating the errors in the logIC50 values by Monte Carlo simulation. Antibody combinations are shown on the y axis with a ratio given for the proportions in which the first and second antibodies are mixed, while the interaction index is shown on the x axis. Interaction indices >1 represent antagonism, while those <1 represent synergy.

