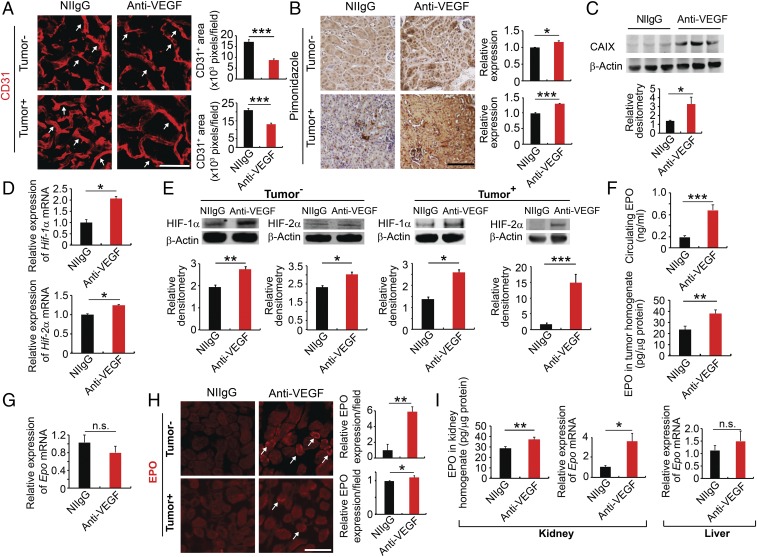
Fig. 1.
Systemic anti-VEGF treatment augments kidney EPO production. (A and B) Kidney cortex CD31+ microvessels and hypoxia pimonidazole+ signals of NIIgG- and anti-VEGF–treated tumor-free and LLC tumor-bearing mice. White arrows point to CD31+ microvessels. CD31+ microvessels and pimonidazole+ signals were randomly quantified from 12 fields (n = 6 samples per group). (C) Western blotting analysis of CAIX in the NIIgG- and anti-VEGF–treated kidney cortex (n = 5 samples per group). (D) qPCR analysis of Hif1α mRNA and Hif2α mRNA expression levels of NIIgG- and anti-VEGF–treated kidney cortex of LLC tumor-bearing animals (n = 5 samples per group). (E) Western blotting analysis of HIF-1α and HIF-2α of the kidney cortex of tumor-free and LLC tumor-bearing animals (n = 3 samples per group). (F) ELISA measurements of EPO protein levels (n = 5 samples per group). (G) Epo mRNA levels of NIIgG- and anti-VEGF–treated tumors (n = 6 samples per group). (H) EPO protein staining of NIIgG- and anti-VEGF–treated kidney cortex of tumor-free and LLC tumor-bearing animals. White arrows point to EPO+ staining. Quantification of EPO positive signals (n = 6–8 random fields per group). (I, Left and Center) ELISA analysis of EPO protein levels and qPCR analysis of Epo mRNA levels of the kidney cortex of tumor-bearing animals (n = 6 tissue samples per group). (I, Right) Epo mRNA expression levels of livers of LLC tumor-bearing animals (n = 6 tissue samples per group). Data are means ± SEM. Animal experiments were repeated twice. *P < 0.05; **P < 0.01; ***P < 0.001. n.s., not significant. (Scale bars: 50 μm.)

