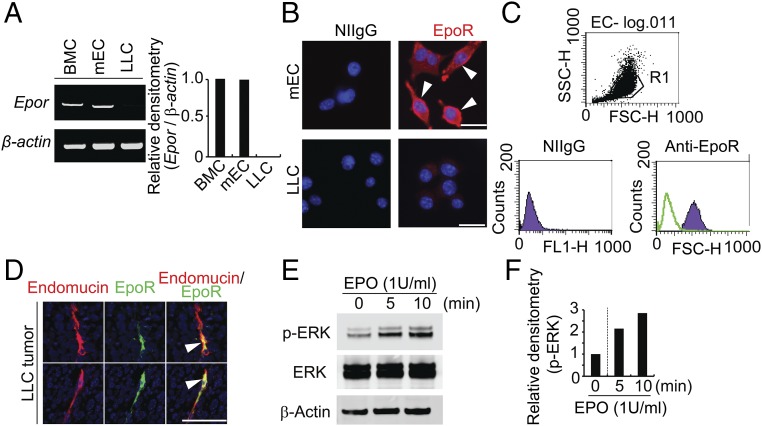
Fig. 2.
EPO-EpoR–triggered endothelial cell signaling and functions. (A) RT-PCR analysis of Epor mRNA levels in different cell types. Bone marrow cell (BMC) served as a positive control. (B) Immunocytochemical staining of EpoR-positive signals in mEC cells (Upper) and LLC cells (Lower). (C) FACS analysis of EpoR expression on mEC cells. (D) Immunocytochemical staining of EpoR positive signals in LLC tumor tissue. (E and F) Western blotting analysis of phospho-ERK, total-ERK, and β-actin levels of each treated and nontreated samples. Mouse endothelial cells were stimulated with 1 U/mL human recombinant EPO for indicated time points. Densitometry of p-ERK–positive signals. Experiments were repeated twice. (Scale bars: 50 μm.)

