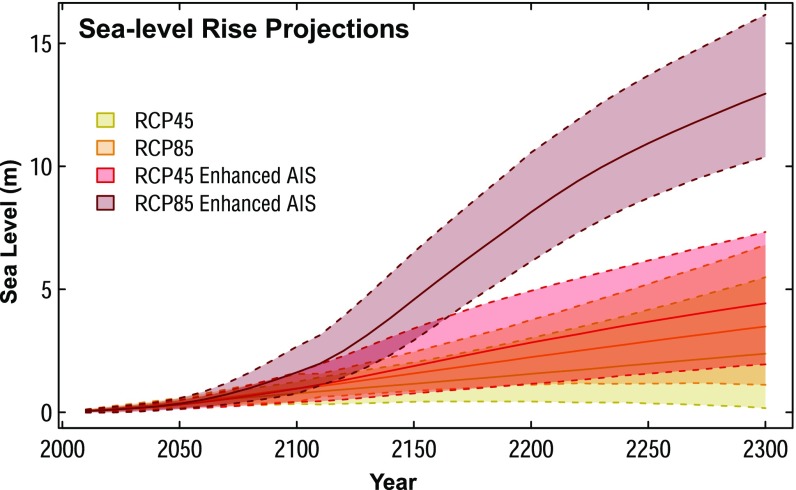
Fig. 4.
Sea-level projections from 2010 to 2300. Projections are calculated using RCP4.5 (yellow) and RCP8.5 (orange) projections (21) and for projections combining AIS contributions from ref. 26 with the RCP4.5 (red) and RCP8.5 (dark red) projections from ref. 21. Lines and shaded regions represent the median and the central 95% credible interval.

