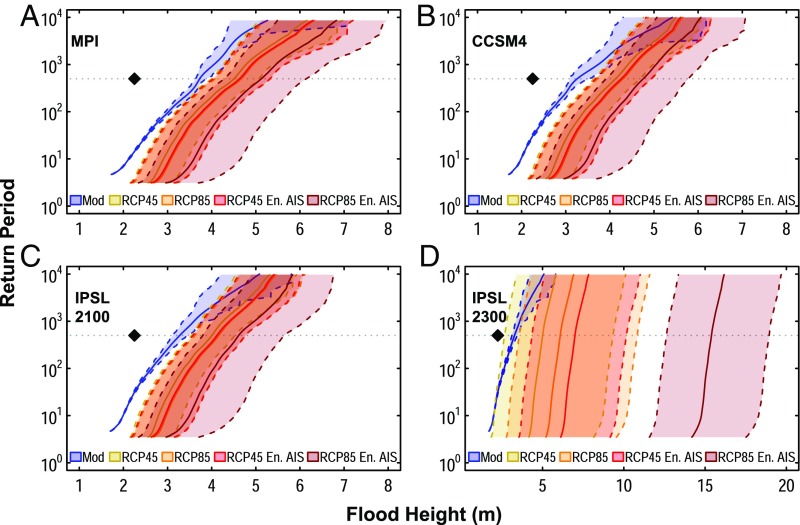
Fig. 6.
Return periods of flood heights. Results are for the modern (1970–2005) and future eras for flood heights calculated using the RCP4.5 (yellow) and RCP8.5 (orange) SLR projections (21) and for flood heights calculated by combining enhanced AIS contributions (26) with the RCP4.5 (red), and RCP8.5 (burgundy) SLR projections (21). Results are shown for future simulations for (A) the MPI model, (B) the CCSM4 model, (C) the IPSL model, and (D) the IPSL model to 2300. The gray, horizontal dotted line on each plot indicates the 500-y return period, and the black diamond on each plot indicates the 500-y flood height (2.25 m) for the preindustrial era (4); mean and 95% credible intervals of flood heights for each return period are shown by the solid line and the shaded region between dashed lines on each plot.

