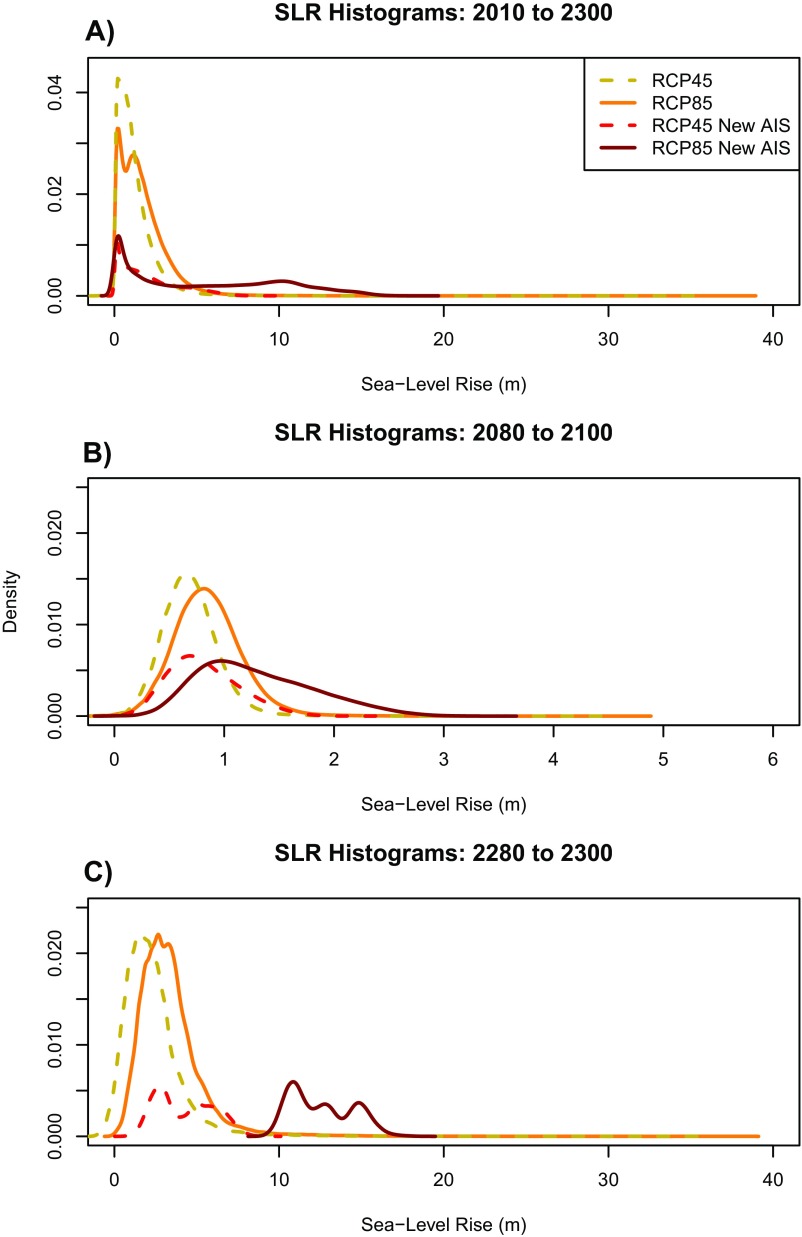
Fig. S8.
Histograms of localized SLR projections for NYC. Results shown for (A) 2010–2300, (B) 2080–2100, and (C) 2280–2300 from ref. 21, in gold (RCP 4.5 scenario) and orange (RCP 8.5 scenario), and ref. 21 using an AIS contribution from ref. 26, in red (RCP 4.5 scenario) and burgundy (RCP 8.5 scenario). Distributions represent 10,000 MC samples of projected SLR from ref. 21. It should be noted that SLR distributions using the AIS contribution from ref. 26 are based on a limited number of model runs at this time and thus do not represent proper PDFs. The SLR distributions shown here are combined with future storm-surge heights to produce future flood heights.

