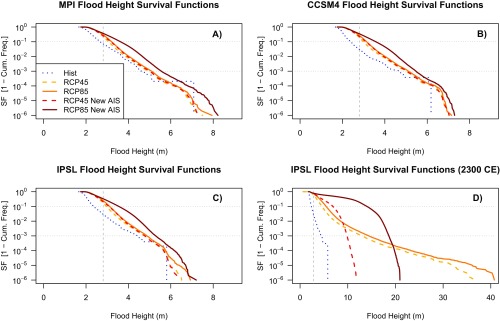
Fig. S9.
Survival functions of flood heights. Results are shown for the modern era (4) and future era for flood heights calculated using the RCP 4.5 (yellow) and RCP 8.5 (orange) SLR projections (21) and for flood heights calculated by combining AIS contributions from ref. 26 with the RCP 4.5 (red) and RCP 8.5 (burgundy) SLR projections from ref. 21. Survival functions are shown for (A) the MPI model, (B) the CCSM4 model, (C) the IPSL model, and (D) the IPSL model where future simulations extend to 2300. Gray, horizontal dotted lines on each plot indicate the 90th- and 99.9th-percentile event frequencies; the gray, vertical dashed line on each plot indicates the flood height associated with Hurricane Sandy in 2012.

